

Most cameras will display the histogram for every image in review mode, while some newer cameras with an electric view finder (EVF) will display it in real time. It can be a very useful tool to reference overall exposure and to make sure detail is not lost in highlights for shadows.
What is an image Histogram?
Definition: A Histogram is a graphical representation of the tonal values of a particular image. It can reference just the amount of light and dark pixels present in the image (mono-tone) or the red, green, and blue channels of an image. 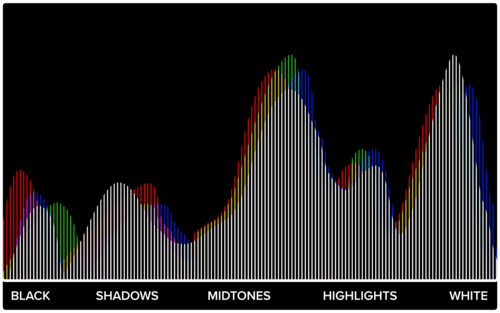
How to read the Histogram
The farthest left hand side of the graph represents absolute black. The farthest right hand side of the graph represents absolute white. The range between left and right represents all the values between black and white, including mid-tones.
- The exact middle of the graph represents 18% grey.
- The height of the peaks represent the amount of pixels that hold a particular tonal value.
- The graph is measured from 0 to 255, 0 representing black and 255 representing white. Each bar (potential spike) is one pixel wide on the graph.

Images with lots of dark tones will display tonal values "squished" to the left side of the graph.

Images with lots of bright tones will display tonal values "squished" to the right side of the graph.

"Normally" exposed images will have a spread of dark tones, bright tones and mid-tones throughout. This is NOT however, a reliable way to decide whether or not your image is "correctly" exposed as this can be misleading. Images taken of the night sky for example, will be pushed to the left, with very little mid-tones, even though the image is exposed correctly.

The most important part of a histogram is the bounding areas on the left or the right side of the graph. Any tonal values touching these "walls" have lost all detail and will show up as absolute black or white in the final image. This loss of detail is not recoverable, even when shooting RAW. Usually a red or yellow triangle will appear on the top left or right side of the graph to warn you when this is occurring. If this is not intentional, simply change exposure to compensate in the opposite direction to pull the "lost" tonal values away from the wall.
Blogpost and video created by Lane Peters